Nationwide study follows up widespread corruption and heat biases found at NOAA stations in 2009, and the heat-bias distortion problem is even worse now
ARLINGTON HEIGHTS, IL (July 27, 2022) – A new study, Corrupted Climate Stations: The Official U.S. Surface Temperature Record Remains Fatally Flawed, finds approximately 96 percent of U.S. temperature stations used to measure climate change fail to meet what the National Oceanic and Atmospheric Administration (NOAA) considers to be “acceptable” and uncorrupted placement by its own published standards.
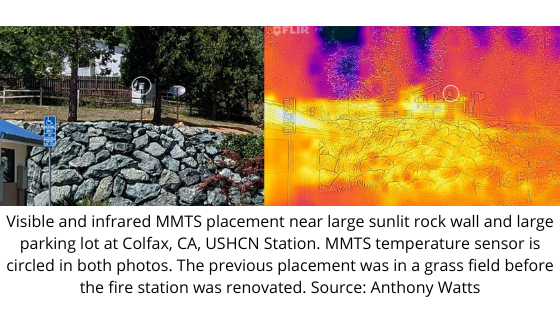
The report, published by The Heartland Institute, was compiled via satellite and in-person survey visits to NOAA weather stations that contribute to the “official” land temperature data in the United States. The research shows that 96% of these stations are corrupted by localized effects of urbanization – producing heat-bias because of their close proximity to asphalt, machinery, and other heat-producing, heat-trapping, or heat-accentuating objects. Placing temperature stations in such locations violates NOAA’s own published standards (see section 3.1 at this link), and strongly undermines the legitimacy and the magnitude of the official consensus on long-term climate warming trends in the United States.
“With a 96 percent warm-bias in U.S. temperature measurements, it is impossible to use any statistical methods to derive an accurate climate trend for the U.S.” said Heartland Institute Senior Fellow Anthony Watts, the director of the study. “Data from the stations that have not been corrupted by faulty placement show a rate of warming in the United States reduced by almost half compared to all stations.”
NOAA’s “Requirements and Standards for [National Weather Service] Climate Observations” instructs that temperature data instruments must be “over level terrain (earth or sod) typical of the area around the station and at least 100 feet from any extensive concrete or paved surface.” And that “all attempts will be made to avoid areas where rough terrain or air drainage are proven to result in non-representative temperature data.” This new report shows that instruction is regularly violated.
For more information, or to speak with the authors of this study please contact Vice President and Director of Communications Jim Lakely at [email protected] or call/text 312-731-9364.
This new report is a follow up to a March 2009 study, titled “Is the U.S. Surface Temperature Record Reliable?“ which highlighted a subset of over 1,000 surveyed stations and found 89 percent of stations had heat-bias issues. In April and May 2022, The Heartland Institute’s team of researchers visited many of the same temperature stations as in 2009, plus many not visited before. The new survey sampled 128 NOAA stations, and found the problem of heat-bias has only gotten worse.
“The original 2009 surface stations project demonstrated conclusively that the federal government’s surface temperature monitoring system was broken, with the vast majority of stations not meeting NOAA’s own standards for trustworthiness and quality. Investigations by government watchdogs OIG and GAO confirmed the 2009 report findings,” said H. Sterling Burnett, director of the Arthur B. Robinson Center on Climate and Environment Policy at The Heartland Institute who surveyed NOAA surface stations himself this spring. “This new study is evidence of two things. First, the government is either inept or stubbornly refuses to learn from its mistakes for political reasons. Second, the government’s official temperature record can’t be trusted. It reflects a clear urban heat bias effect, not national temperature trends.”
An example of the bias problem
The chart below, found on page 17 of the report, shows 30 years of data from NOAA temperature stations in the Continental United States (CONUS). The blue lines show recorded temperatures and the trend from stations that comply with NOAA’s published standards. The yellow lines are temperatures taken from stations that are not compliant with those standards (i.e. near artificial hot spots). The red lines are the “official” adjusted temperature released by NOAA.
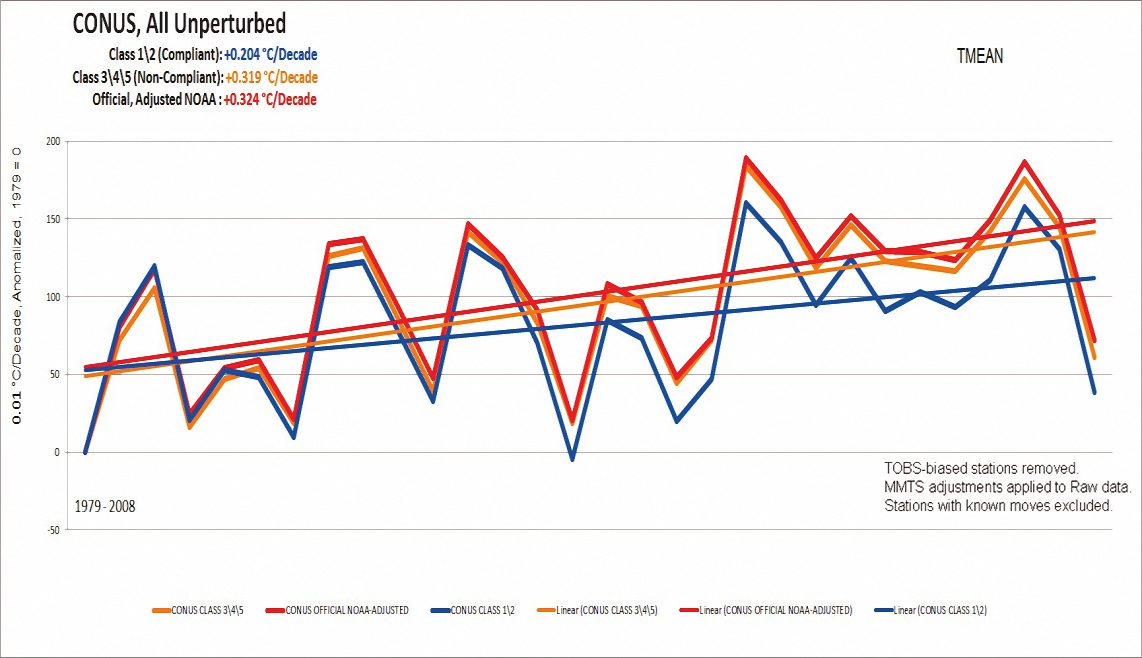
“If you look at the unperturbed stations that adhere to NOAA’s published standard – ones that are correctly located and free of localized urban heat biases – they display about half the rate of warming compared to perturbed stations that have such biases,” Watts said. “Yet, NOAA continues to use the data from their warm-biased century-old surface temperature networks to produce monthly and yearly reports to the U.S. public on the state of the climate.”
“The issue of localized heat-bias with these stations has been proven in a real-world experiment conducted by NOAA’s laboratory in Oak Ridge, Tennessee and published in a peer reviewed science journal.” Watts added.
“By contrast, NOAA operates a state-of-the-art surface temperature network called the U.S. Climate Reference Network,” Watts said. “It is free of localized heat biases by design, but the data it produces is never mentioned in monthly or yearly climate reports published by NOAA for public consumption.
The Heartland Institute, a free-market think tank founded in 1984, is one of the world’s leading organizations promoting the work of scientists who are skeptical that human activity is causing a climate crisis.
Heartland has hosted 14 International Conferences on Climate Change attended by thousands since 2008, published the six-volume Climate Change Reconsidered series by the Nongovernmental International Panel on Climate Change, and for 21 years has published Environment and Climate News. The Heartland Institute has also published several popular books on the climate, including Why Scientists Disagree About Global Warming (2015), Seven Theories of Climate Change (2010), and Is the U.S. Surface Temperature Record Reliable? (2009).
###

Anthony Watts is a senior fellow for environment and climate at The Heartland Institute.

H. Sterling Burnett, Ph.D., is the Director of the Arthur B. Robinson Center on Climate and Environmental Policy and the managing editor of Environment & Climate News.


Jim Lakely is the Vice President and Director of Communications of The Heartland Institute.